Bitcoin's Next Move: Price Prediction Guide for Smart Traders
Discover the most accurate Bitcoin price prediction this week, key market trends, and smart trading insights to guide your next decision.
Hassan Abdullah
7/5/202512 min read


Bitcoin's Next Move: Price Prediction Guide for Smart Traders
Introduction
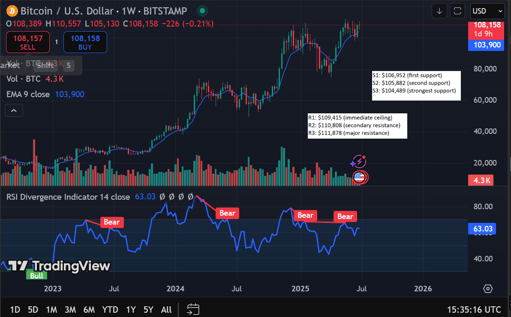
Bitcoin price prediction next week looks particularly interesting as the cryptocurrency continues its impressive market run. Following a strong second quarter with nearly 30% gains, we're seeing Bitcoin trade just below $109,000 after breaking through a key consolidation range. While the current price hovers around $108,225, with recent trading confined to a tight range between $107,386 and $109,117, many traders are eyeing what comes next.
The bitcoin prediction this week points to potential volatility as the market digests recent movements. Though Bitcoin has fallen over 30% from its all-time high, renewed optimism has emerged amid institutional interest. Looking at the bigger picture, bitcoin price prediction 2025 estimates range from conservative floors of $87,460 to ambitious ceilings of $265,500. In this guide, we'll provide a comprehensive bitcoin price prediction for next week's analysis, examining both technical indicators and fundamental factors that smart traders should monitor before making their next move.
Key Takeaways
Smart Bitcoin traders need to balance short-term technical signals with long-term institutional trends to navigate the cryptocurrency's evolving market dynamics effectively.
Bitcoin currently trades near $109,000 expert 2025 predictions ranging from $80,000 to $200,000, driven by institutional ETF adoption
Technical indicators show cautious optimism, but declining volume trends suggest potential consolidation before major moves
Smart risk management requires limiting exposure to 1-2% per trade and using multiple time frame analyses for entry/exit decisions
Institutional adoption through ETFs has fundamentally changed Bitcoin's volatility profile, making it more correlated with traditional assets
Combining RSI, MACD, and volume analysis provides stronger trading signals than relying on single indicators alone
The cryptocurrency has matured from a speculative asset to an institutional portfolio component, creating new opportunities for traders who understand both technical patterns and fundamental adoption drivers. Success requires disciplined risk management alongside strategic use of leverage through futures and ETF instruments.
Where Bitcoin Stands Today
As the fifth day of July 2025 draws to a close, Bitcoin remains a dominant force in the cryptocurrency landscape. Currently trading at $108,197.89, Bitcoin has shown remarkable resilience despite its characteristic volatility. Let's examine where the world's premier digital asset stands right now and what traders might expect in the coming days.
Current price and market cap
Bitcoin commands an impressive market capitalization of $2.15 trillion, solidifying its position as the #1 cryptocurrency by a substantial margin. With a circulating supply of 19.88 million BTC (about 94.7% of its maximum supply of 21 million), Bitcoin's scarcity continues to be a fundamental driver of its value.
The 24-hour trading volume stands at approximately $36.83 billion, representing a 13.29% increase. This substantial trading activity indicates ongoing investor interest, despite Bitcoin trading approximately 3.16% below its all-time high reached in May 2025. Institutional adoption remains robust, with BlackRock and Fidelity providing significant exposure through exchange-traded funds, which largely fueled Bitcoin's rise above the $100,000 milestone.
Recent price movements and volatility
Bitcoin closed the second quarter of 2025 with impressive gains of nearly 30%, driven primarily by increasing corporate and institutional demand. After breaking out of a consolidation range and briefly touching $110,530 on Thursday, Bitcoin experienced a slight pullback to its current level just below $109,000.
The cryptocurrency's volatility, although still higher than traditional assets, has notably decreased compared to previous years. According to recent data, Bitcoin's daily standard deviation has dropped to approximately 2.1%, down from 5.3% in 2021. This reduced volatility places Bitcoin closer to commodities like crude oil than to more volatile alternative cryptocurrencies.
Interestingly, Bitcoin now exhibits a +0.49 correlation with high-yield corporate bonds and +0.52 with tech stocks, yet maintains a -0.29 correlation with the U.S. dollar. This correlation pattern positions Bitcoin as both a risk-on asset and a macro hedge—a duality that institutional investors increasingly exploit for portfolio diversification.
Bitcoin prediction this week: what to expect
Technical indicators suggest Bitcoin is positioned within an approximate horizontal trend channel in the short term, indicating potential continued movement in the current direction. The currency has recently given a positive signal from the rectangle formation by breaking through the resistance at $107,710, potentially signaling a further rise to $115,727 or beyond.
Additionally, Bitcoin is currently testing resistance at $109,000, which could trigger a negative reaction in the short term. However, should an upward breakthrough occur at this level, it would generate a positive signal for continued growth.
For this specific week, analysts predict Bitcoin could rise by up to 5%, with a potential target range of $110,000-$112,000, provided bulls maintain momentum. Key factors to watch include:
The RSI (Relative Strength Index) curve, which currently shows a rising trend supporting the positive outlook
Trading volume, which despite being down 24% since last Friday, still surpasses market averages
Resistance levels at $109,000 and $109,762, which, if broken, could trigger new bullish signals
Given Bitcoin's recent breakout from its consolidation range and strong quarterly performance, smart traders should prepare for continued volatility with a cautiously optimistic bias for the coming week.
Short-Term Forecast: This Week and Next
Looking at short-term Bitcoin trends reveals intriguing potential for traders navigating July's market conditions. After establishing our baseline understanding of Bitcoin's current position, let's examine specific forecasts, critical price levels, and volume indicators that could shape trading outcomes in the immediate future.
Bitcoin price prediction for next week's analysis
Predictions for Bitcoin next week vary significantly across analytical platforms. CoinCodex forecasts Bitcoin will trade between $118,907 and $137,803 by July 14, suggesting a potential increase of 15.89% from current levels. Conversely, Coinlore offers a more conservative outlook, projecting $108,129 by July 14.
Changelly's analysis presents an especially bullish scenario, predicting Bitcoin could reach $131,719 by July 7, representing a 21.26% surge. Their forecast continues with a peak of $141,643 by July 8 before moderating to approximately $136,000 for the remainder of the week.
Technical analysis from Investtech indicates a positive signal from the rectangle formation following Bitcoin's break through the $107,710 resistance. This breakthrough essentially signals further upside potential toward $115,727. Furthermore, Bitcoin is developing an inverse head and shoulders formation, which typically precedes upward price movement.
Overall, the technical sentiment remains cautiously optimistic, with Barchart's composite indicator showing a 100% Buy signal with "Good" strength that appears to be "Strengthening".
Key support and resistance levels
Based on the classical pivot point analysis, Bitcoin currently has three critical support levels:
S1: $106,952 (first support)
S2: $105,882 (second support)
S3: $104,489 (strongest support)
Correspondingly, resistance levels that traders should monitor include:
R1: $109,415 (immediate ceiling)
R2: $110,808 (secondary resistance)
R3: $111,878 (major resistance)
Barchart's analysis identifies slightly different but complementary levels, with the first support at $106,742 and the first resistance at $109,396. The second resistance point is noted at $111,026, with a third at $112,051.
Bitcoin is currently testing the critical resistance around $109,000, creating a pivotal decision point. A breakthrough above this level would generate a positive signal for continued growth, yet failure could trigger a pullback toward the first support. These levels become especially significant considering Bitcoin's current price range between $108,143 and $111,909.
Short-term trading volume trends
Volume indicators present a concerning picture despite positive price action. The spot volume delta (measuring net buying versus selling) remains negative, suggesting the current rally lacks substantial buying interest. This divergence between price and volume typically precedes price consolidations or pullbacks.
Essentially, seasonal patterns compound this concern as July historically represents a low-volume month, accounting for merely 6.1% of annual trading activity. The period from June through October traditionally experiences reduced spot trading volumes, potentially limiting Bitcoin's ability to sustain new highs in the immediate term.
Current volume metrics show a 20-day average volume of 5,130 and a 50-day average volume of 5,931. For comparison, the 100-day average stands at 7,879, confirming the declining volume trend.
Consequently, Bitcoin appears likely to experience range-bound price action in the short term, with potential volatility triggered by resistance tests. According to CoinCodex, Bitcoin is forecasted to trade within a range of $109,159 to $118,907 this week, representing a potential 8.93% increase if it reaches the higher target.
Regardless of short-term fluctuations, the overall technical sentiment remains positive across multiple timeframes, with all 13 indicators on Barchart showing Buy signals. Nevertheless, traders should remain vigilant about volume confirmation before entering new positions, especially given the current elevated market greed index of 73.
Long-Term Outlook: 2025 and Beyond
Beyond the weekly price fluctuations, major financial institutions and crypto analysts have mapped out substantial growth for Bitcoin through 2025 and beyond. Their forecasts paint a picture of substantial upside potential, albeit with significant variance in projected targets.
Bitcoin price prediction 2025: expert ranges
Expert predictions for Bitcoin's 2025 valuation span an impressive range. At the conservative end, investing analysts project a minimum of $80,840 to a maximum of $151,150. More optimistic forecasts from CoinCodex suggest Bitcoin will trade between $105,670 and $179,681 during 2025, with an annual average of $127,169.
Institutional forecasts trend even higher. Standard Chartered maintains a year-end 2025 target of $200,000, mirroring Bernstein analysts who likewise predict $200,000. Peter Brandt has revised his initial forecast to between $120,000 and $200,000 by September 2025.
Certain maverick predictions extend considerably higher, with Samson Mow projecting $1 million by the end of 2025, Chamath Palihapitiya forecasting $500,000 by October 2025, and Mike Novogratz suggesting a long-term target of $1 million.
Wave count and logarithmic growth curve
Elliott Wave theorists have recently updated their analysis of Bitcoin's market structure. Gert van Lagen's revised wave count identifies Bitcoin as entering Wave 5 of its current cycle, potentially targeting $395,000. This projection aligns with a parabolic curve expected to peak in August 2025.
The Bitcoin Rainbow Chart, based on logarithmic growth curves, provides context for these projections. This model overlays rainbow color bands on Bitcoin's logarithmic growth trajectory, with warmer colors indicating potential profit-taking zones and cooler colors suggesting accumulation opportunities.
The logarithmic growth function (y = 10^(a * log10(x) - b)) models Bitcoin's historical price movements and projects future ranges. Importantly, this analysis shows diminishing returns in percentage terms even as absolute price increases remain substantial.
Institutional adoption and ETF impact
The approval of spot Bitcoin ETFs has fundamentally altered Bitcoin's adoption curve. ETF inflows have been substantial, with firms managing $100 million or more accumulating $27.4 billion in Bitcoin ETF holdings by Q4 2024.
A scientific study in the Journal of Financial Economics confirmed that the introduction of spot Bitcoin ETFs significantly affected cryptocurrency returns and volatility, revealing a positive impact on Bitcoin price returns and decreased volatility, supporting the market stabilization hypothesis.
Institutional adoption has evolved from cautious exploration to serious capital allocation. BlackRock and traditional financial advisors now recommend a 1-6% Bitcoin allocation in balanced portfolios, potentially driving sustained demand through 2025 and beyond.
Technical Indicators Smart Traders Watch
Smart traders rely on various technical indicators to make informed decisions about Bitcoin's price movements. These tools offer valuable insights into market psychology and potential price directions beyond simple chart patterns.
Relative Strength Index (RSI)
The RSI measures momentum by calculating the speed and change of price movements on a scale from 0 to 100. Readings above 70 typically indicate overbought conditions, suggesting a potential reversal or selloff, whereas readings below 30 signal oversold conditions, hinting at a potential rally. The RSI works best in ranging markets where drops in momentum at extremes often precede reversals. Interestingly, research shows that for Bitcoin specifically, RSI works better as a momentum indicator rather than a mean reversion tool. Subsequently, this means traders should focus more on RSI trends rather than absolute values when trading Bitcoin.
MACD and moving averages
The Moving Average Convergence Divergence (MACD) consists of two lines that oscillate without boundaries and are primarily used for trading trends. The indicator includes three components: the MACD line, signal line, and histogram. When the MACD line crosses above the signal line, it suggests upward momentum, particularly when occurring below the zero line. Specifically, the distance between these lines, visualized by the histogram, indicates trend strength. Moving averages themselves provide crucial context, with the Simple Moving Average (SMA) showing the average price over time and the Exponential Moving Average (EMA) putting more weight on recent days. The EMA responds more quickly to new price movements, making it better for identifying short-term trends.
Stochastic Oscillator and CCI
The stochastic oscillator compares a security's closing price to its price range over a set period, generating readings between 0 and 100. Generally, readings above 80 indicate overbought conditions while readings below 20 suggest oversold territory. The oscillator consists of two lines: %K (fast) and %D (slow). When %K crosses above %D, it signals a potential buying opportunity, especially effective in trending markets. Meanwhile, the Commodity Channel Index (CCI) measures the difference between the current price and the historical average. Values above +100 suggest strong upward momentum, possibly indicating overbought conditions, while readings below -100 signal strong downward momentum. The CCI excels at detecting breakouts before they occur, offering early entry signals.
Volume and volatility metrics
Volume-volatility relationships provide crucial insights for Bitcoin traders. Research reveals that unexpected trading volume explains approximately 20% of the variation in Bitcoin spot price volatility. Moreover, CME Bitcoin futures volumes play a surprisingly limited role in systemic volatility. This relationship between volume and price movement helps traders identify sustainable trends—price increases on rising volume generally indicate stronger momentum than those occurring on declining volume. Ultimately, combining volume analysis with technical indicators creates a more comprehensive trading approach, reducing false signals and improving overall performance.
Strategies for Smart Bitcoin Traders
Successful Bitcoin trading requires more than just following price predictions—it demands a strategic approach to market movements. Let's explore practical tactics that can help maximize gains while protecting your capital.
How to interpret technical signals
Successful traders rarely rely on a single indicator. Instead, they combine multiple signals to confirm trends. For instance, when RSI readings align with MACD crossovers, the resulting signal becomes significantly stronger. Primarily, look for confluence—when multiple indicators suggest the same direction simultaneously. Essentially, this approach filters out false signals that might trigger premature entries.
Risk management and stop-loss planning
Risk management forms the foundation of profitable trading. The golden rule? Never risk more than 1-2% of your total portfolio on a single trade. Set stop-loss orders at predetermined exit points to limit potential losses. These orders automatically sell your cryptocurrency when it reaches your risk threshold.
For Bitcoin specifically, consider placing stop-losses just below key support levels. A well-placed 10% stop-loss strikes a balance between giving your position room to breathe and preventing catastrophic losses. Henceforth, remember that recovering from a 50% loss requires a 100% gain just to break even.
When to enter and exit trades
Multiple time frame analysis provides clarity for identifying optimal entry and exit points. Firstly, analyze higher timeframes to understand the overall trend direction. Then, examine medium timeframes for potential support/resistance levels, finally using lower timeframes for precise entries.
Set take-profit targets based on risk-reward ratios, typically aiming for at least 2:1. This means targeting twice your potential loss as your gain. Certainly, trailing stop-losses can help lock in profits as prices move favorably.
Using futures and ETFs for leverage
Bitcoin futures ETFs offer exposure to price movements without directly holding Bitcoin. These instruments enable leveraged positions, amplifying both potential gains and losses. Yet, unlike margin trading, leveraged ETFs limit downside risk to your initial investment.
Trading futures contracts provides greater flexibility than leveraged ETFs, with some platforms offering up to 4x leverage in increments as small as 1/100th of a Bitcoin. Indeed, these instruments require regular management as contracts expire monthly.
Conclusion
Bitcoin remains a fascinating asset class as we head toward the middle of 2025, balancing between its established status and significant growth potential. The cryptocurrency's current trading range near $109,000 represents just one moment in its evolving story. Smart traders should therefore consider both immediate opportunities and long-term trajectories when planning their Bitcoin strategy.
Short-term technical signals point to potential volatility with cautiously optimistic momentum. Still, the concerning volume trends deserve attention before making any major moves. Most notably, the convergence of multiple indicators offers stronger signals than any single metric could provide.
Looking beyond weekly fluctuations, Bitcoin price predictions for 2025 span from conservative estimates around $80,000 to ambitious projections reaching $200,000 or higher. Nevertheless, these forecasts depend heavily on continued institutional adoption, which has fundamentally transformed Bitcoin's market dynamics through ETF investments and portfolio recommendations.
Successful Bitcoin trading ultimately requires more than following price predictions. Smart risk management means setting proper stop-losses, ideally risking no more than 1-2% of your portfolio on a single trade. Additionally, multiple timeframe analysis helps identify optimal entry and exit points with favorable risk-reward ratios.
Whether you choose spot trading, futures contracts, or ETF exposure, Bitcoin's unique combination of institutional acceptance and technical patterns offers exceptional opportunities. Cryptocurrency has evolved from a speculative experiment to a legitimate asset class that deserves serious consideration in any forward-thinking investment strategy.
FAQs
Q1. What is the projected price range for Bitcoin in 2025? Expert predictions for Bitcoin's price in 2025 vary widely, ranging from conservative estimates of $80,000 to more ambitious projections of $200,000 or higher. These forecasts are based on factors such as institutional adoption, market trends, and historical price patterns.
Q2. How do technical indicators help in Bitcoin trading? Technical indicators like RSI, MACD, and moving averages help traders identify potential trends, overbought or oversold conditions, and momentum shifts in Bitcoin's price. Combining multiple indicators often provides stronger signals than relying on a single metric, allowing for more informed trading decisions.
Q3. What role do Bitcoin ETFs play in the market? Bitcoin ETFs have significantly impacted the cryptocurrency market by providing easier access for institutional investors. They have contributed to increased adoption, potentially reduced volatility, and have become a substantial driver of Bitcoin's price movements and long-term growth potential.
Q4. How can traders manage risk when trading Bitcoin? Effective risk management in Bitcoin trading involves setting stop-loss orders, typically risking no more than 1-2% of your total portfolio on a single trade. Using multiple timeframe analysis for entry and exit points and maintaining a favorable risk-reward ratio (such as 2:1) are also crucial strategies.
Q5. What is the significance of volume in Bitcoin trading? Volume is a critical metric in Bitcoin trading as it helps confirm price movements and trend strength. High volume during price increases generally indicates stronger momentum. However, recent data shows declining volume trends, which could suggest potential consolidation before major price movements.
Thinky Talks
Stay updated on crypto, blockchain, and innovation.
© 2025. All rights reserved.
Disclaimer: Thinky Talk is for educational purposes only and should not be considered financial or investment advice. Always do your own research before making financial decisions.

