Top 5 Crypto Trading Indicators You Need to Master in 2025
Discover 5 best and must-know crypto trading indicators for 2025. Learn how to use RSI, MACD, volume tools & more for better entries, trends & profit potential.
UPDATES
5/14/20256 min read


In a fast-moving world of cryptocurrency trading, relying on hype and gut feeling just doesn’t do it anymore. If you are learning in 2025, one of the best skills for trading is how to use crypto trading indicators. Using these indicators, you can spot price strength, entry points, and possibly market reversal. Many beginner traders make the mistake of trading without a proper strategy, which leads them to losses. In this guide, I will walk you through 5 essential trading indicators for beginners, showing you how to apply them with precision, even if you’re just starting out in crypto technical analysis.
Relative Strength Index (RSI)
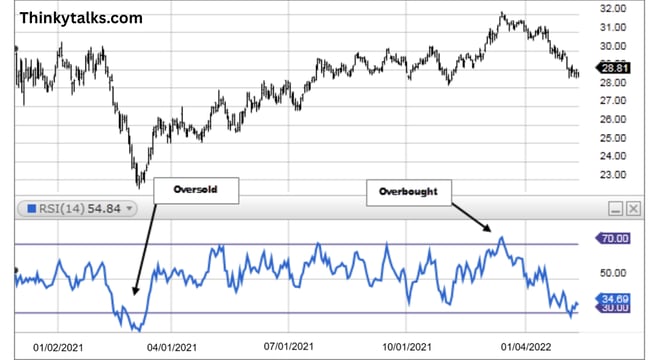
J. Welles Wilder Jr. is the creator of the Relative Strength Index. The relative strength index is the best momentum oscillator, which is used to measure the speed of price movements. It provides the visual mean to monitor both the current and historical strength and weakness of the particular market.
RSI is used primarily to identify oversold and overbought condition.
RSI below 30 oversold shows condition while RSI above 70 shows overbought condition. For example, if a security is repeatedly reaching the overbought level of 70 you may want to adjust this level to 80.
Divergence of price movement and RSI signals market reversal.
RSI can be combined with other indicators to strengthen the trading strategy.
How to calculate RSI?
Formula: RSI = 100 − (100 / (1 + RS))
Where:
RS (Relative Strength) = average gain over a specified period / average loss over the same period
Traders use RSI in various ways, including identifying overbought and oversold conditions, confirming trends, and spotting possible reversals via divergences.
Moving Averages (SMA & EMA)
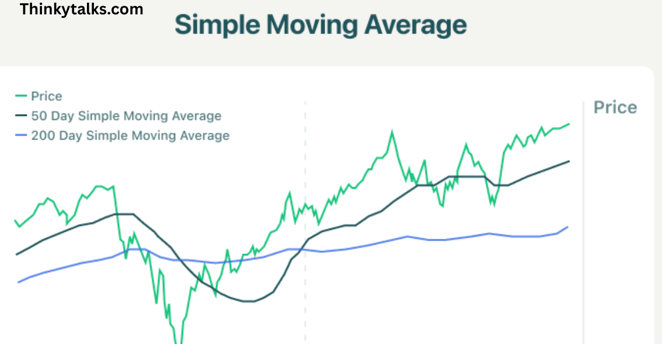
Simple moving average (SMA):
Simple moving average is the indicator use for identifying the average price of the security. It uses simple arithmetic average of the price in some timespans.
Formula: SMA = A1 + A2 + …. A (N) ÷ N
Where: A = Average in period, n = Number of time periods
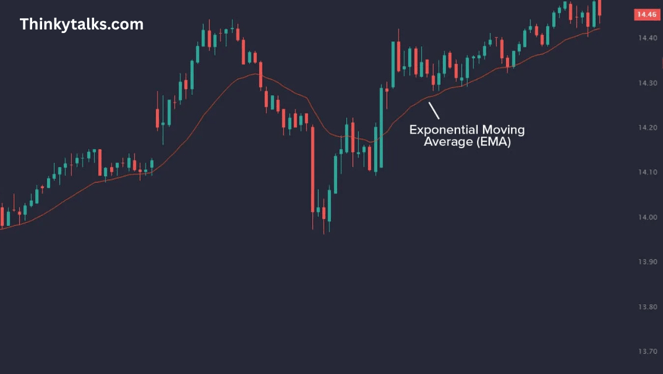
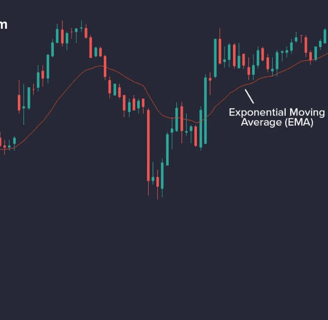
Exponential moving average (EMA)
EMA uses more recent prices to make it more responsive to the new information. To calculate an EMA, the simple moving average (SMA) over a particular period is calculated first. Then we calculate the smoothing factor by using this formula: {2 ÷ (selected time period + 1)}
What is smoothing factor?
The smoothing factor is a number that determines how much weight recent data (like today’s price) gets compared to older data in a moving average.
For a 20-day moving average, the multiplier would be [2 / (20 + 1)] = 0.0952.
Formula: EMAt = [Vt × (1 + ds)] + EMAy × [1 - (1 + ds)]
Where:
EMAt = EMA today
VT = Value today
EMAy = EMA yesterday
d = Number of days
Simple Moving Average (SMA) vs. Exponential Moving Average (EMA)
SMA adds up the prices from the past N days and divides by N, while EMA uses a smoothing factor to make the line respond faster to recent changes.
As compare to SME, EMA has the faster reaction towards the price movement.
SMA is used for long term strategy while EMA is used for short term strategy.
In summary, SMA is smoother, less reactive, and better for long-term analysis, while EMA is more reactive, good for short-term analysis, and may generate more signals.
MACD (Moving Average Convergence Divergence)
Moving average convergence/divergence is an indicator which show the relation between two moving average of the security price.
MACD helps investor to identify the entry points for buying and selling.
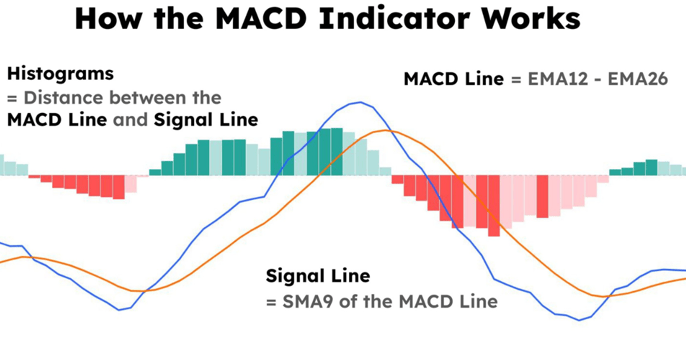
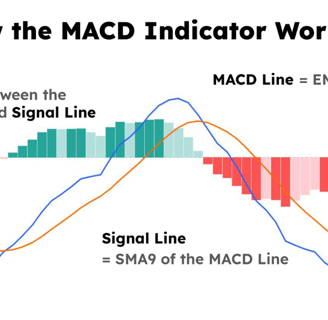
The MACD line is calculated by subtracting the 26-period exponential moving average (EMA) from the 12-period EMA.
The signal line is a nine-period EMA of the MACD line.
Traders may buy the security when the MACD line crosses above the signal line and sell or short the security when the MACD line crosses below the signal line.
MACD indicators can be interpreted in several ways, but the more common methods are crossovers, divergences, and rapid rises/falls.
MACD Formula:
MACD = 12-Period EMA − 26-Period EMA
How this indicator works?
MACD crossing above zero is considered bullish, while crossing below zero is bearish.
When MACD turns up from below zero it is considered bullish. When it turns down from above zero it is considered bearish.
When the MACD line crosses from below to above the signal line, the indicator is considered bullish. The further below the zero line the stronger the signal.
When the MACD line crosses from above to below the signal line, the indicator is considered bearish. The further above the zero line the stronger the signal.
Divergence between the MACD and the price action is a stronger signal when it confirms the crossover signals.
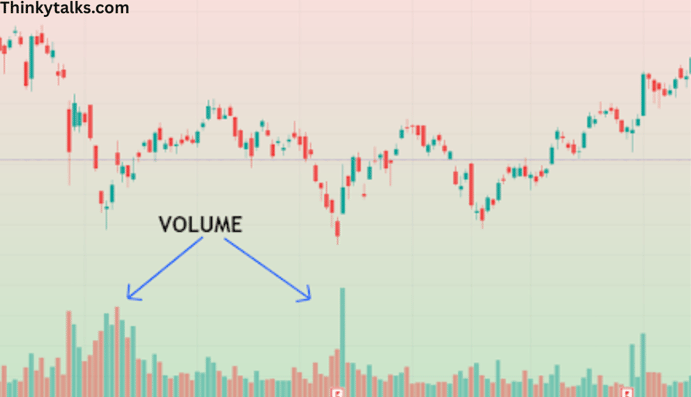
Volume
Volume is the total number of shares that are traded, usually within a single day. Stock volume is measured by counting the total number of shares that are transacted between buyers and sellers, also called absolute volume.
Understanding Stock Volume:
Understanding stock volume is one the basic and main indicator used for better trading decisions. Stock volume is important because it shows how much interest there is in a particular stock.
High trading volume means more people are actively buying and selling the stock, indicating strong public interest, while low volume suggests limited activity. Traders often analyze volume alongside price action; if a stock closes higher than it opened, it signals an upward trend, and if it closes lower, it's a downward trend. A change in the stock’s direction is known as a reversal, and volume can help confirm whether that reversal is strong or weak.
Key Volume Indicators:
Volume Moving Average: Name of this indicator shows that it tells us about the average volume of the stock over the specific period. It helps identify unusual activity by comparing current volume to the average, signaling potential trend strength or reversals.
On-Balance Volume: This indicator is used to identify the price movement to check whether the market is in an accumulation phase or a selling phase. It adds volume on up days and subtracts volume on down days.
Volume-Weighted Average Price (VWAP): This indicator shows the average price of the asset, weighted by trading volume. It gives a more accurate reflection of an asset’s true average price by considering both price and volume, rather than just the price alone.
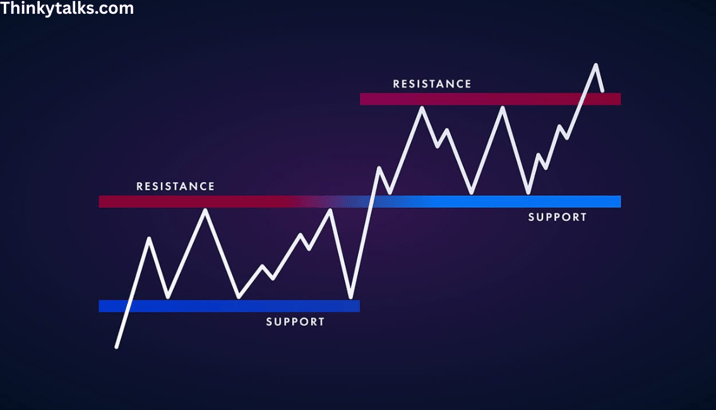
Support and Resistance Zones
Support and resistance is one of the most widely used concepts in technical analysis. Both the concept helps in identifying the entry and exit points in the market.
Resistance: When price go up and then pull back, the highest point reached before the pullback is called resistance.
Resistance levels indicate where there will be a surplus of sellers, creating selling pressure that resists upward price movement. Resistance acts like a “ceiling” stopping the price from rising further.
Support: When price continue up again, the lowest point reached before it started back is now support.
Support levels indicate where there will be a surplus of buyers, creating buying pressure that supports the price. It acts like a “floor” that prevents prices from falling further.
How to Identify Support and Resistance Zones for Better Trades:
One thing to remember is that support and resistance are not exact numbers. Sometimes it looks like resistance or support is broken, but soon after we find out that the market was just testing it.
What Happens When Support or Resistance is Broken?
When price breaks through support or resistance, it often signals a significant change in market sentiment.
Breaking Support: When support is broken, it can lead to a further price decline as it signals a shift in control from buyers to sellers. Traders may look to go short.
Breaking Resistance: When resistance is broken, it can lead to a price rally, signaling that buyers have taken control. This is a bullish sign, and traders may look to go long.
Mastering crypto trading indicators is no longer optional in 2025; it’s essential. Indicators like RSI, MACD, moving averages, and volume-based tools offer traders powerful insights into market behavior, trend reversals, and entry/exit signals. If you're just beginning your crypto trading journey, understanding these tools can significantly improve your decision-making and reduce emotional trades. Combine these indicators with strong risk management and a well-researched strategy to make more informed and confident trades. As you grow your experience, these tools will become your trading edge in the highly volatile and fast-evolving crypto market.
If you are a beginner, hit this link and start learning basics. https://thinkytalks.com/crypto-updates-blogs
Thinky Talks
Stay updated on crypto, blockchain, and innovation.
© 2025. All rights reserved.
Disclaimer: Thinky Talk is for educational purposes only and should not be considered financial or investment advice. Always do your own research before making financial decisions.

